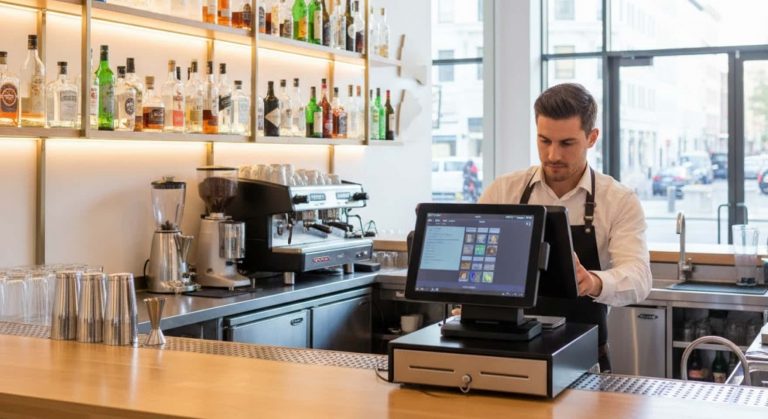
Cafe POS System with Kitchen Screen: Cash Register, Kitchen and Staff in One Connection
16 March 2026
Read

Food service management accounting — what most owners postpone until better times. Cash register works, guests come, revenue exists. But why there’s less money at month end than should be — unclear. Food service financial accounting conducted either in spreadsheets or not conducted at all. Syrve closes this gap: P&L, cash flow and food service dish cost calculates automatically, without separate accountant and Excel with 40 tabs.
Restaurant P&L in report — not just revenue minus expenses. It’s structure: what brought money, what consumed it and where gap between gross and net profit. In Syrve cafe profit and loss report generated automatically based on cash register, warehouse and expense item data.
Food service operating expenses in system broken down by categories: products, staff, rent, other. Each item can be configured for own establishment structure. Owner sees not just final figure but which item grew and why margin dropped 3% compared to last month.
Food service automation software with built-in P&L saves 4–6 hours monthly just on reporting compilation — time owner usually spends reconciling data from different sources.
Restaurant cash flow — separate report confused with P&L. P&L shows profit. Cash flow shows whether money on account right now. Establishment can be profitable on paper and simultaneously lack funds for Thursday purchase.
Syrve records all receipts and payments tied to dates. Visible: when banquet money came, when went to supplier, when rent written off. Restaurant budgeting based on this data stops being guessing — owner sees real cash cycle of their establishment.
Cafe expense management through cash flow especially important in low season. When exactly know large payment in two weeks — manage to prepare, not frantically search money last day.
Restaurant profitability calculation starts with each dish separately. Food cost control in Syrve shows cost as percentage of sale price — per item, per category, entire menu at once. Immediately visible: here’s dish with 18% food cost, and here — with 47%.
Dish margin calculation in system updates automatically when supplier prices change. Chicken became expensive — system recalculated cost of all chicken dishes and showed where margin fell below norm. No need to manually dig into recipe cards.
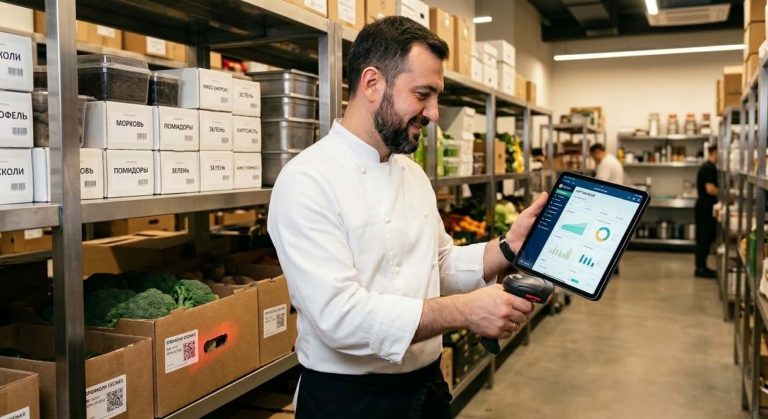
Food service accounting system at Restasystem allows building profitability reports in any period breakdown: day, week, month, season.
Menu ABC analysis divides items into three groups by revenue and profit. Group A — hits that feed establishment. Group C — items ordered rarely and earn little. Keeping them in menu — means spending on their purchase, storage and cook time.
Restaurant sales XYZ analysis adds second dimension: demand stability. Dish can give decent revenue but sell chaotically — feast or famine. This creates write-off losses. Combine both analyses — means understand what really worth keeping in menu and what better eliminate.
Both tools available in Syrve without additional add-ons. Reports built in 1–2 minutes for any selected period.
Management accounting in Syrve — not separate system on top of existing. Data taken from same cash register and warehouse already working. Simply they stop lying dead weight and start showing real picture: where restaurant break-even point, which dishes drag margin down and which month usually lacks money. Financial report configuration for specific establishment takes 1–2 days. More details about how this looks in work — can learn from team through management accounting in Syrve.