In-house delivery service: zones, routes, and calculation with couriers
9 October 2026
Read

There is 12,500 euros of revenue in the register, but when it’s time to pay suppliers, the account is empty. Familiar situation? This problem arises when an owner manages register balances rather than real numbers. Proper restaurant financial reporting shows where your money is actually disappearing. If you are just preparing to open in Europe, first study how to set up restaurant accounting from scratch. If your establishment is already operating, you need an effective financial accounting system. Let’s break down the specific reports that save you from cash gaps every day.
Money in the cafe register is just revenue. Of course, the tax service is happy with high turnovers, charging VAT and other tax obligations. However, a high level of income by no means guarantees profitability. When salaries, rent, and utilities eat up the entire margin, your business generates losses. Effective restaurant financial management requires looking at the net balance. This is what special cafe financial indicators are for.
A basic restaurant Profit and Loss (P&L) report shows the efficiency of operational activities. It should reflect the real expenses of the establishment, not formal lines for the tax service. This is the main restaurant report for assessing profitability. Example: Revenue 30,000 EUR, food cost 10,000 EUR, rent 3,750 EUR, payroll 8,750 EUR, net profit 2,500 EUR. What decision the owner makes seeing these numbers: they realize the operating margin is a critical 8% and immediately cut the bloated staff or look for cheaper food suppliers.
Cash flow records all physical transactions. Any restaurant financial report will be incomplete without strict control of settlements. A P&L report can show a solid plus, but if money is frozen in the warehouse, a cash gap occurs. Example: Balance at the beginning of the month 1,250 EUR, receipts 20,000 EUR, payments to suppliers, for rent and taxes 23,000 EUR, deficit -1,750 EUR. What decision the owner makes seeing these numbers: they negotiate a two-week payment deferment with contractors to cover the minus with the upcoming weekend’s receipts.
Food cost is the pulse of the establishment. You must clearly know how to calculate the cost of a dish so as not to feed guests at a loss. The restaurant industry lives on a very modest margin. A sudden jump in the purchase price of salmon can destroy all profit. Example: Food cost in the “Steaks” category rose from 31% to 40% due to the rising cost of tenderloin (a loss of 550 EUR in margin). What decision the owner makes seeing these numbers: they remove steaks from promotional offers and instruct the chef to rework the side dish portions to balance the plate.
Deep cafe financial analysis is impossible without assessing the team’s efficiency. Successful chain establishments regularly measure how much money one employee in the restaurant generates. This allows you to optimize shift schedules. Example: Waiter A brings in 875 EUR per shift, Waiter B — 300 EUR for the same number of hours. What decision the owner makes seeing these numbers: they pair Waiter B with a stronger colleague for training or fire them to avoid losing potential hall revenue.
We wrote about the average check: how to calculate and increase it earlier. But in the context of reports, not only the average check itself is important, but also its depth — the average number of items per order. Example: The average check remained at 15 EUR, but the check depth dropped from 3.2 to 2.0. Guests stopped ordering additional dishes. What decision the owner makes seeing these numbers: they launch an incentive game for waiters on the mandatory sale of desserts with coffee and add profitable combo meals to the menu.
Warehouse shortages are a direct hit to your pocket. By understanding the types of write-offs and proper documentation, you reliably protect your material stock. During surprise inspections, you see the real picture unembellished. Example: The amount of write-offs due to food spoilage was 625 EUR per month instead of the normative 125 EUR. What decision the owner makes seeing these numbers: they reduce the daily purchase volumes of perishables and introduce stricter temperature control in the walk-in coolers.
Not all menu items are equally useful for the cash register. Regular ABC analysis of the menu clearly highlights stars and outsiders. This is a fundamental tool for modern restaurants. Example: “Roast Beef Salad” generates 40% of the entire marginal profit of the cold prep area (bringing 750 EUR in pure plus). What decision the owner makes seeing these numbers: they move this item to the best spot in the physical menu and launch targeted social media ads with its photo.
You need to manage your business systematically and calmly. Use these 7 tips for organizing management accounting to build the right daily discipline in your establishment.
| Report | Frequency | What to look at |
|---|---|---|
| Revenue and average check | Daily | Fulfillment of the daily plan, total number of checks |
| Discounts and deletions report | Daily | Abnormal pre-check cancellations (theft risk) |
| Cash flow | Weekly | Account balances, weekly payment plan |
| Food cost and productivity | Weekly | Deviations from the norm, overall staff efficiency |
| P&L (Profit and Loss) | Monthly | Net profit, operating expenses, profitability |
| Menu ABC analysis | Monthly | Changes in demand for high-margin items |
| Write-offs and inventory | Monthly (weekly for the bar) | Shortage amounts, warehouse balance discrepancies |
Strict standards exist in the economics of the restaurant business. The industry dictates these frames: food cost should be 25-33%, labor costs around 20-25%, and premises rent no more than 10-12%. These indicators are equally relevant for all food service formats. If you manage a chain of locations or have several roadside diners, a serious deviation from these figures signals problems. Planned revenue growth should be set at 10-15% per year to ensure organic company growth. Many companies go bankrupt precisely due to a banal disregard for industry benchmarks. Top restaurants always keep their food cost within the set limits, strictly preventing it from being artificially lowered at the expense of quality.
To manage an establishment effectively, you need reliable management accounting software. Collecting data manually in disparate spreadsheets is a thing of the past. Modern accounting software makes all the routine unnoticeable to the manager.
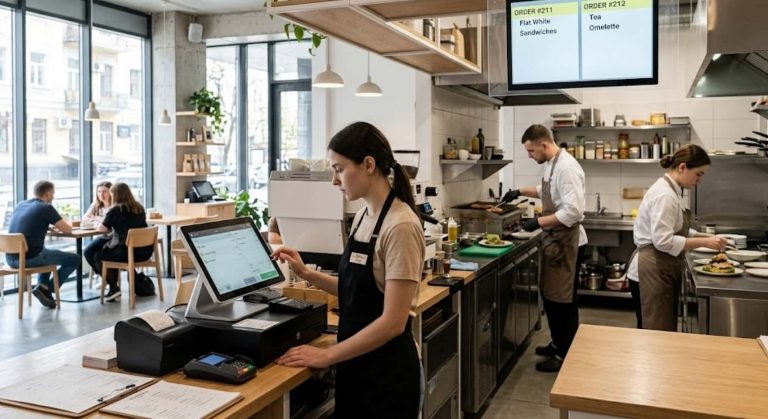
The innovative Syrve system fully automates accounting in the restaurant business at all levels. Waiters use the fast SyrveWaiter mobile terminal, chefs see tickets on KDS screens, and the POS works stably even offline. Any tax transaction is recorded instantly. Built-in fiscal integrations ensure 100% fiscalization of sales. If your establishment operates with different tax systems, the terminal automatically separates goods into the correct accounts.
No more gray schemes or bar fraud will pass. Automation allows you to instantly detect even the most complex combinations of theft schemes, making incomplete fiscalization completely impossible. Thanks to Syrve’s interactive dashboard panel on your smartphone, you always see real numbers. This allows you to effectively minimize financial risks, managing real results rather than blind intuition. This is your peace of mind and a guarantee of stable profit.